
 By Renard Teipelke
I am sure combined rankings exist. Rankings where cities are evaluated and scored for both their quality of living and their cost of living. But generally, the leading rankings of “livable cities” do not concern themselves much with cost factors. One indirect reason might be that it is probably the jetsetting expat who is most interested in such rankings and s/he is most often remunerated well enough to not care too much about the average price of a sandwich or a cab ride or a doctor’s visit. The first two might fall under business travel expenditures anyhow and the last item is covered by expats’ global health insurance.
But accounts of a city’s livability (which in itself is a highly contested matter, see here and here) is actually most relevant to a city’s residents, as they are the ones who are living there “full time”. Therefore, a livability ranking needs to be combined with a cost of living perspective, if a certain ranking’s methodology does not already include related factors. In short: A truly livable city does not only provide the natural, social, and economic features that make it worthwhile and enjoyable to live in; it does also offer the financial conditions for its (current/future) residents to afford these features.
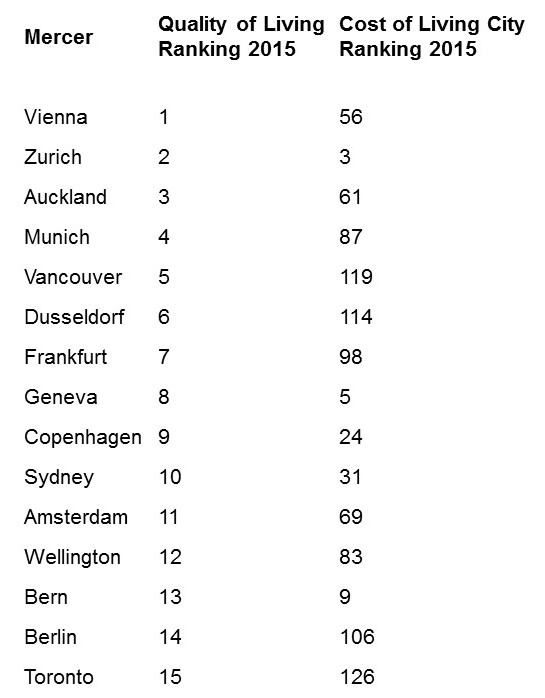
Therefore, I took a crack at the well-known Mercer cities rankings. You can find their cities list for quality of living here and their cities list for cost of living here. I combined the two rankings working with the rank/position of each city in the rankings (not their scores) – you can find the results for the top 15 quality of living cities in comparison to their cost of living rank in the table below (top ranks in the quality of living refer to a [positive] high livability, while top ranks in the cost of living refer to [negative] high living costs).
I then took the ranks and included a cost quotient (based on the cost of living rank of a city) in the quality of living ranking. In the table below you can find the results of this computation for the top 15 quality of living cities, with the lines in-between highlighting the Vienna case and all cities which significantly moved up or down the list.
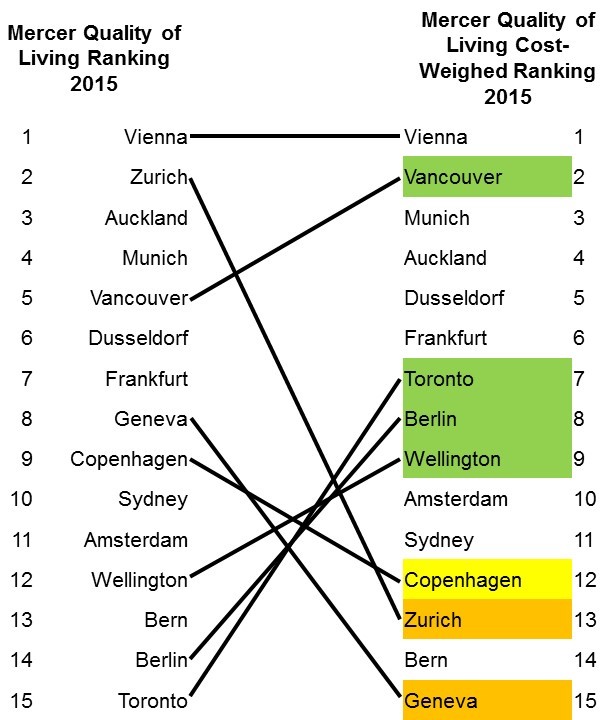
As becomes quickly apparent, Vienna (Austria) manages to be No. 1 in both the quality of living ranking and the cost-weighed quality of living ranking. The cities of Vancouver and Toronto (Canada), Berlin (Germany), and Wellington (New Zealand) move up several ranks when cost of living is factored into the quality of living ranking. Not surprisingly, the high-ranked quality of living cities Zurich and Geneva fall down to join Bern (all Switzerland) at the end of the cost-weighed ranking. A somewhat lower rank is assigned to Copenhagen (Denmark) when cost of living factors are included. Other cities from Germany, New Zealand, and the Netherlands change their rank only slightly.
Now, what do we conclude from this? I guess a more comprehensive look at the whole ranking (going through all positions from 1 to 230) helps, because otherwise we just see how the cities with the best quality of living are reordered in another exclusive list. For sure, Vienna keeping the first rank is already interesting. And the rise of some cities might hint at reconsidering city comparisons that are so easily done at after-work parties and on airplanes (…expats…). But let us look at the whole picture and see what happens. (A couple of (partly well-known) cities are unfortunately missing in either of the two Mercer rankings and are, thus, omitted in the combined list – see far below for the complete list).
The 50 best cost-weighed livable cities (combined ranking, see table below) do not show too many surprising results and changes amongst the first ranks. However, there are a number of cities that move up by 12, 34, or even more than 50 ranks. There is, for example, Nuremberg (Germany) that is No. 12 in the cost-weighed quality of living ranking. Or Lisbon (Portugal) that jumps from rank 41 to 21. The list goes on with several other well-known candidates of livable cities that seem to score by being less expensive for living than their “competitors”; for instance, Leipzig (Germany) jumping from 59 to 25, Budapest (Hungary) jumping from 75 to 30, Warsaw (Poland) jumping from 79 to 32, or Cape Town (South Africa) jumping from 91 to 33. It is particularly a group of Eastern European cities that benefits from a cost-weighed quality of living ranking (see table below). When I took a look at the Top 50 I was reminded of an older blog post where I discussed the potential strengths and advantages of such “global second-row status” cities (here).
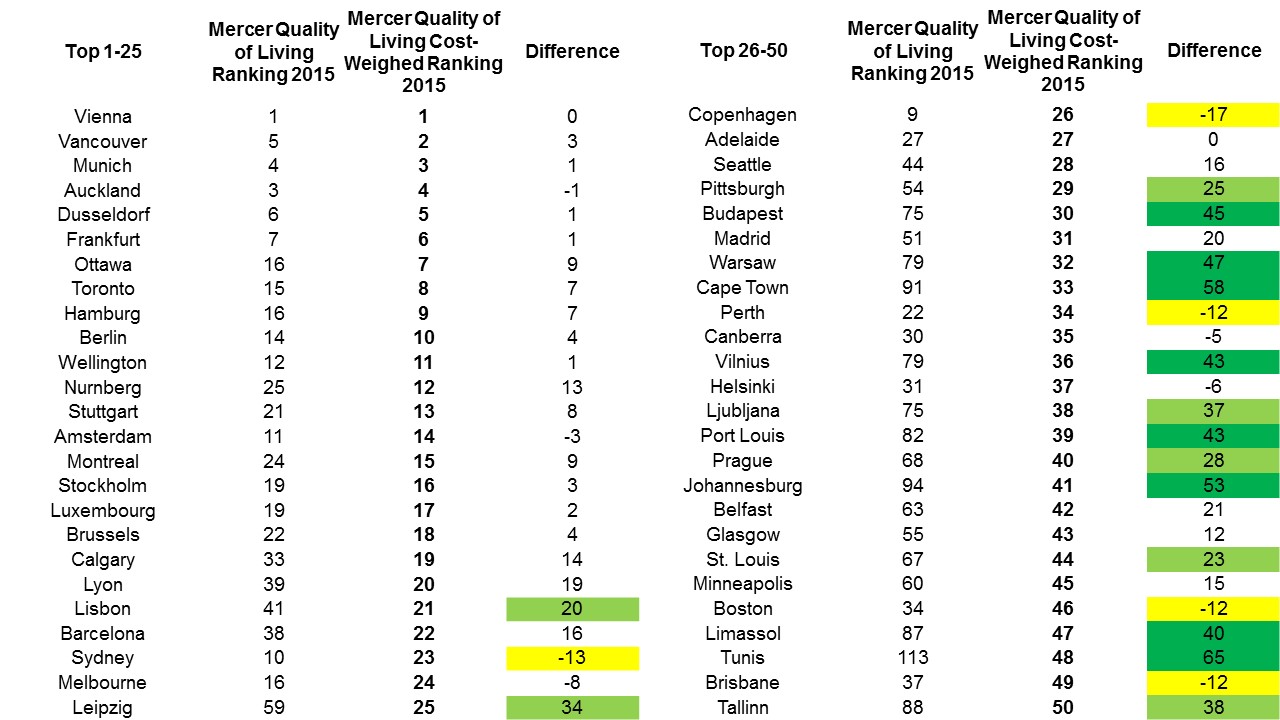
However, having a city like Tunis (Tunisia) now ranked amongst the 50 “most-livable-still-affordable” cities might hint at a weakness of this computation, which is also confirmed when you identify the biggest winners in the combined ranking. These cities jump 60 to nearly a 100 positions in the cost-weighed ranking, but hardly any of them are amongst the better half of livable cities. Thus, the cost advantage of cities like Harare (Zimbabwe), Minsk (Belarus), or Karachi (Pakistan) does not make them so much better places to live in. What’s the low cost of services and amenities good for, when you cannot access them due to their unavailability?!

Looking at the biggest losers in the cost-weighed quality of living ranking reveals no surprises: The big metropolises, such as Singapore (Singapore), Tokyo (Japan), London (UK), New York City (USA), and Seoul (South Korea), fall down more than a 100 ranks due to their extraordinary high cost of living. This pretty much resembles the everyday struggles of millions of residents in these (and similar) cities, where some livability features can be jointly enjoyed, while many others are only affordable to a small(er) group of residents and visitors.

Accepting the likely conceptual and methodological flaws within such cities rankings (as well as in my tampered cross-computation), I find a cost-weighed quality of living ranking more realistic and relevant than those glitzy quality of living rankings that somehow assume a resident’s ability to access the livability features with ease. The results at the top and bottom of the list (see below) are, however, less revealing than the group of second-best cities, positions 26-50. These cities are performing an interesting role in the (perceived) international city competition and require further attention.
| Mercer Quality of Living Ranking 2015 | Mercer Quality of Living Cost-Weighed Ranking 2015 | Difference | |
| Vienna | 1 | 1 | 0 |
| Vancouver | 5 | 2 | 3 |
| Munich | 4 | 3 | 1 |
| Auckland | 3 | 4 | -1 |
| Dusseldorf | 6 | 5 | 1 |
| Frankfurt | 7 | 6 | 1 |
| Ottawa | 16 | 7 | 9 |
| Toronto | 15 | 8 | 7 |
| Hamburg | 16 | 9 | 7 |
| Berlin | 14 | 10 | 4 |
| Wellington | 12 | 11 | 1 |
| Nurnberg | 25 | 12 | 13 |
| Stuttgart | 21 | 13 | 8 |
| Amsterdam | 11 | 14 | -3 |
| Montreal | 24 | 15 | 9 |
| Stockholm | 19 | 16 | 3 |
| Luxembourg | 19 | 17 | 2 |
| Brussels | 22 | 18 | 4 |
| Calgary | 33 | 19 | 14 |
| Lyon | 39 | 20 | 19 |
| Lisbon | 41 | 21 | 20 |
| Barcelona | 38 | 22 | 16 |
| Sydney | 10 | 23 | -13 |
| Melbourne | 16 | 24 | -8 |
| Leipzig | 59 | 25 | 34 |
| Copenhagen | 9 | 26 | -17 |
| Adelaide | 27 | 27 | 0 |
| Seattle | 44 | 28 | 16 |
| Pittsburgh | 54 | 29 | 25 |
| Budapest | 75 | 30 | 45 |
| Madrid | 51 | 31 | 20 |
| Warsaw | 79 | 32 | 47 |
| Cape Town | 91 | 33 | 58 |
| Perth | 22 | 34 | -12 |
| Canberra | 30 | 35 | -5 |
| Vilnius | 79 | 36 | 43 |
| Helsinki | 31 | 37 | -6 |
| Ljubljana | 75 | 38 | 37 |
| Port Louis | 82 | 39 | 43 |
| Prague | 68 | 40 | 28 |
| Johannesburg | 94 | 41 | 53 |
| Belfast | 63 | 42 | 21 |
| Glasgow | 55 | 43 | 12 |
| St. Louis | 67 | 44 | 23 |
| Minneapolis | 60 | 45 | 15 |
| Boston | 34 | 46 | -12 |
| Limassol | 87 | 47 | 40 |
| Tunis | 113 | 48 | 65 |
| Brisbane | 37 | 49 | -12 |
| Tallinn | 88 | 50 | 38 |
| Detroit | 70 | 51 | 19 |
| Zagreb | 97 | 52 | 45 |
| Paris | 27 | 53 | -26 |
| Bratislava | 81 | 54 | 27 |
| Monterrey | 109 | 55 | 54 |
| Sofia | 115 | 56 | 59 |
| Bucharest | 110 | 57 | 53 |
| Pointe-a-Pitre | 69 | 58 | 11 |
| Athens | 85 | 59 | 26 |
| Atlanta | 66 | 60 | 6 |
| Windhoek | 133 | 61 | 72 |
| Birmingham | 52 | 62 | -10 |
| Rabat | 116 | 63 | 53 |
| Zurich | 2 | 64 | -62 |
| Asuncion | 114 | 65 | 49 |
| Honolulu | 36 | 66 | -30 |
| Dublin | 34 | 67 | -33 |
| Aberdeen | 57 | 68 | -11 |
| Houston | 64 | 69 | -5 |
| Brasilia | 107 | 70 | 37 |
| Belgrade | 141 | 71 | 70 |
| San Francisco | 27 | 72 | -45 |
| Kuala Lumpur | 84 | 73 | 11 |
| Nagoya | 61 | 74 | -13 |
| Gaborone | 144 | 75 | 69 |
| Milan | 41 | 76 | -35 |
| Skopje | 159 | 77 | 82 |
| Bangalore | 146 | 78 | 68 |
| La Paz | 156 | 79 | 77 |
| Riga | 89 | 80 | 9 |
| Dallas | 62 | 81 | -19 |
| San Juan | 72 | 82 | -10 |
| Oslo | 31 | 83 | -52 |
| Santo Domingo | 135 | 84 | 51 |
| Sarajevo | 161 | 85 | 76 |
| Lusaka | 149 | 86 | 63 |
| Kolkata | 160 | 87 | 73 |
| Quito | 129 | 88 | 41 |
| Managua | 173 | 89 | 84 |
| Rome | 52 | 90 | -38 |
| Bogota | 131 | 91 | 40 |
| Muscat | 104 | 92 | 12 |
| Banjul | 184 | 93 | 91 |
| Panama City | 95 | 94 | 1 |
| Casablanca | 128 | 95 | 33 |
| Kampala | 169 | 96 | 73 |
| Mexico City | 126 | 97 | 29 |
| Tirana | 180 | 98 | 82 |
| Montevideo | 78 | 99 | -21 |
| Minsk | 189 | 100 | 89 |
| Blantyre | 177 | 101 | 76 |
| Yerevan | 183 | 102 | 81 |
| Kiev | 176 | 103 | 73 |
| Chennai | 151 | 104 | 47 |
| San Jose | 106 | 105 | 1 |
| Tegucigalpa | 184 | 106 | 78 |
| San Salvador | 172 | 107 | 65 |
| Kingston | 156 | 108 | 48 |
| Tbilisi | 194 | 109 | 85 |
| Karachi | 202 | 110 | 92 |
| Washington, D.C. | 50 | 111 | -61 |
| Bishkek | 208 | 112 | 96 |
| Guatemala City | 150 | 113 | 37 |
| Islamabad | 191 | 114 | 77 |
| Lima | 124 | 115 | 9 |
| Colombo | 132 | 116 | 16 |
| Chicago | 43 | 117 | -74 |
| Algiers | 187 | 118 | 69 |
| Kuwait City | 125 | 119 | 6 |
| Doha | 108 | 120 | -12 |
| Jeddah | 166 | 121 | 45 |
| Dar es Salaam | 198 | 122 | 76 |
| St. Petersburg | 174 | 123 | 51 |
| Miami | 65 | 124 | -59 |
| New Delhi | 154 | 125 | 29 |
| Harare | 206 | 126 | 80 |
| Istanbul | 122 | 127 | -5 |
| Addis Ababa | 205 | 128 | 77 |
| Tashkent | 206 | 129 | 77 |
| Nouakchott | 221 | 130 | 91 |
| Bandar Seri Begawan | 102 | 131 | -29 |
| Santiago | 93 | 132 | -39 |
| Los Angeles | 48 | 133 | -85 |
| Cotonou | 182 | 134 | 48 |
| Phnom Penh | 195 | 135 | 60 |
| Niamey | 217 | 136 | 81 |
| Ouagadougou | 215 | 137 | 78 |
| Jakarta | 140 | 138 | 2 |
| Lome | 204 | 139 | 65 |
| Cairo | 170 | 140 | 30 |
| Manama | 130 | 141 | -11 |
| Bern | 13 | 142 | -129 |
| Geneva | 8 | 143 | -135 |
| Ashkhabad | 210 | 144 | 66 |
| Ho Chi Minh City | 153 | 145 | 8 |
| Rio de Janeiro | 119 | 146 | -27 |
| Nairobi | 186 | 147 | 39 |
| Hanoi | 154 | 148 | 6 |
| Osaka | 58 | 149 | -91 |
| Manila | 136 | 150 | -14 |
| Bamako | 219 | 151 | 68 |
| Almaty | 175 | 152 | 23 |
| Maputo | 178 | 153 | 25 |
| Port of Spain | 147 | 154 | -7 |
| Kigali | 189 | 155 | 34 |
| Dakar | 162 | 156 | 6 |
| Taipei | 83 | 157 | -74 |
| Mumbai | 152 | 158 | -6 |
| Amman | 122 | 159 | -37 |
| Riyadh | 163 | 160 | 3 |
| Abu Dhabi | 77 | 161 | -84 |
| Douala | 196 | 162 | 34 |
| Bangkok | 117 | 163 | -46 |
| Accra | 165 | 164 | 1 |
| New York City | 44 | 165 | -121 |
| Noumea | 111 | 166 | -55 |
| Sao Paulo | 120 | 167 | -47 |
| Yaounde | 192 | 168 | 24 |
| Dubai | 74 | 169 | -95 |
| London | 40 | 170 | -130 |
| Moscow | 167 | 171 | -4 |
| Dhaka | 211 | 172 | 39 |
| Djibouti | 188 | 173 | 15 |
| Abidjan | 209 | 174 | 35 |
| Tel Aviv | 105 | 175 | -70 |
| Tokyo | 44 | 176 | -132 |
| Beirut | 181 | 177 | 4 |
| Chengdu | 133 | 178 | -45 |
| Buenos Aires | 91 | 179 | -88 |
| Nanjing | 137 | 180 | -43 |
| Brazzaville | 224 | 181 | 43 |
| Libreville | 164 | 182 | -18 |
| Victoria | 96 | 183 | -87 |
| Baku | 197 | 184 | 13 |
| Abuja | 213 | 185 | 28 |
| Qingdao | 147 | 186 | -39 |
| Singapore | 26 | 187 | -161 |
| Yangon | 201 | 188 | 13 |
| Shenyang | 156 | 189 | -33 |
| Guangzhou | 121 | 190 | -69 |
| Seoul | 72 | 191 | -119 |
| Shenzhen | 139 | 192 | -53 |
| Conakry | 222 | 193 | 29 |
| Lagos | 211 | 194 | 17 |
| Tehran | 203 | 195 | 8 |
| Shanghai | 101 | 196 | -95 |
| Beijing | 118 | 197 | -79 |
| Kinshasa | 223 | 198 | 25 |
| N’Djamena | 226 | 199 | 27 |
| Hong Kong | 70 | 200 | -130 |
| Luanda | 200 | 201 | -1 |

Interesting stuff. Yet when cost-of-living and quality of life is cross-computed, I’d expect checks and balances on tax level and salary level as well. Cities like Copenhagen and Stockholm has very high costs of living, high quality of life, high tax levels and high salary levels. So in the end this cross-computing might only serve to filter out the extremes, and those extremes are in my opinion signified by incredible inequality. So, to put it short, inequality could be added as one of the checks and balances as well.
Good points. Cross-computing two indices from the same source (which is already better than mixing different sources) is, at first, a thought experiment only to add a certain degree of quantitative analysis to an otherwise qualitative argument. Mercer writes about their methodology for cost-of-living that they take the “comparative cost of more than 200 items in each location” (https://www.imercer.com/products/cost-of-living.aspx) – that would not account for different salary levels for the exact same job in place A and B, true. Regarding tax levels: This would probably require a comparison of above-municipal level in many cases where various taxes are set by state or national governments. A worthwhile analysis that definitely goes beyond the scope of the research for a blog article.
It may be easier to not aim for an overall comparison, but to take a representative (or stereotypical) job from each income latter (e.g. janitor, office assistant, project manager, business director, …) and compare within the job category across cities. Although going beyond national borders for comparison may in practical terms be not relevant for most employees who cannot move freely/easily from Place A to B just because of lower cost of living/higher quality of life.
How does it compare with BIGMAC Index.
Difficult question. I originally was looking at the Big Mac Index etc., but they were either not available for city comparisons or they were limited in their methodology even more than the Mercer indices are. In addition, cross-computing across different indices, methodologies, and sources is even shakier for an argument. What is better about time-based purchasing power ratio indices like the Big Mac Index is that they provide a somewhat better insight into the worth relationship of work-money-costs.
OMG…This is my “Holy Grail”…I’ve always wanted to do a study of “quality of life” vs “cost of living”…and now here it is !!!
Do you have a Twitter account so that I may Follow you ???
No, but I will probably have another article ready that will further investigate quality of life and other urban development concerns versus needs of different socioeconomic groups in cities 🙂